

Price forecasts can explain pressure on fertilizer margins, but they cannot control losses inside a plant. In 2026, uncertainty around energy, feedstock, and logistics makes opex reduction in fertilizer production 2026 a priority. Yet blunt cost cutting can shift the burden to downtime, off-spec product, or maintenance risk. A resilient strategy starts with identifying and controlling plant-level losses.
Separate external market pressures from costs teams can influence, then compare options using consistent measures of savings, quality, throughput, and reliability. An operational change that looks efficient on paper may create costs elsewhere in the process, so assess its net effect rather than one line item.
This practical guide shows how to identify major controllable cost drivers, assess operational and maintenance opportunities, and evaluate specialty chemical optimization as one possible lever. It also explains how to build a measurable, low-risk trial plan using site data, then verify results before scaling a change. The goal is not to cut costs at any price. It is to improve cost control while protecting product quality and dependable operations.
Key Takeaways
- For opex reduction in fertilizer production 2026, distinguish market-driven costs from plant-level consumption, losses, downtime, maintenance, and logistics.
- Build a useful baseline from production, energy, material balance, downtime, and quality records. Compare cost per tonne only across equivalent products and operating boundaries.
- Assess energy, maintenance, process control, material yield, and chemical options against net impact, implementation effort, operational risk, and evidence quality.
- Use a staged roadmap: establish the baseline, prioritize opportunities, run a controlled pilot, then document a decision with input from process, quality, safety, and finance teams.
- Consider specialty chemical optimization as one potential lever. JAS Global Industries supplies fertilizer anti-caking agents, dust suppressants, coloring agents, and granulation aids for plant-specific evaluation.
OPEX Reduction in Fertilizer Production 2026: Separate Market Pressure from Plant Costs
Fertilizer-plant OPEX is the recurring expenditure required to operate production. It includes the resources consumed and work performed during ongoing operations. Capital investment, such as a major equipment upgrade, belongs in a separate evaluation. Market-price movements are external drivers: they can change operating costs without indicating a change in plant performance.
This distinction matters for opex reduction in fertilizer production 2026. A higher feedstock bill may reflect market exposure, not a process failure. Excess energy use, material losses, avoidable downtime, maintenance demands, or inefficient handling may point to operating opportunities. Logistics can involve both: internal movement and loading practices may be influenced by the site, while freight rates and supplier terms may be largely external.
Build the cost map around a useful level of detail: production line, product grade, operating period, and unit of sale. Keep accounting boundaries consistent. Compare the same cost categories across equivalent periods and products, and state whether the unit is a tonne produced, a tonne meeting specification, or a tonne sold. These measures answer different questions. For context on fertilizer types, uses, and production, see this overview of fertilizer production.
Which fertilizer production costs can a plant influence?
Review recurring cost categories and identify which operating decisions can affect each one:
- Energy and feedstock: Track consumption separately from supplier prices, contract terms, and other market exposures.
- Labor and maintenance: Examine work practices, recurring interventions, planned maintenance, and unplanned downtime.
- Handling, packaging, and quality: Look for material losses, rework, product outside specification, and avoidable movement.
- Logistics: Distinguish site-controlled scheduling and handling from external freight conditions.
Assign each cost to the process area responsible for it, but do not assume every cost is directly controllable. A department may influence energy consumption without controlling the energy price. Separating those factors makes comparisons fairer and directs attention toward changes the site can actually test.
Why 2026 market volatility makes a site-level baseline essential
Geopolitical disruption and supply-chain uncertainty continue to shape fertilizer markets in 2026. IFPRI provides market-level context on how disruption can affect fertilizer markets, production, and food security; CoBank connects geopolitical and supply-chain pressures with pricing and sourcing uncertainty. Use this analysis to frame exposure, not to claim that a particular plant can achieve a specific saving. The plant’s own records must establish its baseline.
To make that baseline decision-ready, segment records by line, grade, and period. Reconcile production volumes with energy, feedstock, maintenance, downtime, quality, and handling data. If handling losses or product condition are under review, the fertilizer anti-caking overview offers relevant context. Use the baseline to identify which operational changes merit closer evaluation.
Diagnose Fertilizer Plant OPEX: Find Losses Across Production and Handling
A reliable diagnosis traces where inputs enter the process and where usable product, time, or energy is lost. Follow material from receiving and storage through processing, granulation, finishing, and dispatch. At each stage, connect operating observations to production, maintenance, inventory, laboratory, and procurement records. This turns a broad cost concern into a specific question: what changed, where did it occur, and which records support the explanation?
Keep accounting definitions visible. A higher cost per tonne might reflect a change in product mix, operating hours, or input prices rather than poorer performance. Before assigning a variance to a process step, flag missing readings, inconsistent loss codes, and unclear cost allocations.
Build a usable OPEX baseline from plant records
Choose a defined comparison period and assemble production volumes, energy use, material balance, downtime, maintenance work orders, laboratory results, inventory movements, and procurement records. Reconcile these sources so inputs, finished product, rejected material, and recorded losses use consistent units. Normalize comparisons for grade, product mix, operating hours, and relevant production conditions. Otherwise, unlike periods may appear comparable when they are not.
Measurement rule: Compare like-for-like production periods before assigning savings. If a record is incomplete, document the gap and its effect on confidence instead of filling it with an assumption. This keeps later decisions grounded in evidence.
Find avoidable loss in fertilizer handling and finished product
Inspect each handoff for caking, dust, spillage, handling damage, rework, rejected product, or storage-related disruption. Log each observation by material, location, time, and operating condition. For example, record a recurring issue at a transfer point separately from a storage problem, even if both affect the same grade; when mechanical bottlenecks or chronic spillage are identified, evaluating conveyor system integration services can address recurring physical transfer issues. Where available, pair observations with weighments, quality results, downtime logs, and inventory adjustments.
Keep potential interventions distinct. Anti-caking measures relate to product flow and caking observations; dust suppression relates to dust during handling; granulation aids relate to the granulation stage. Do not combine these into one “chemical savings” figure. Separate records make it possible to assess each option against the loss it is intended to address, while checking that product quality and reliable operation remain protected.
For a practical diagnostic, use a loss register with fields for process step, material or grade, observed issue, evidence source, data gap, and accountable owner. Rank entries by recurrence and operational consequence, not by an unverified estimate of savings. Then select the best-documented cases for closer evaluation. This gives opex reduction in fertilizer production 2026 a plant-specific foundation rather than relying on broad assumptions. Where records point to handling or product-flow issues, JAS Global Industries’ fertilizer chemical solutions can be considered as one potential lever, with benefits assessed through site data and verified results.
Compare Fertilizer OPEX Reduction Levers by Net Impact and Operational Risk
A cost initiative is useful only if its benefit holds up across the whole process. Compare options using the same baseline, then assess the proposed mechanism, effort, operational risk, and strength of evidence. Separate lower input prices from lower consumption: a purchasing change may reduce unit price, while an operating change may reduce the quantity used. Check for cost transfers too, such as lower handling expense paired with added maintenance or quality-control work.
Use a common decision record for each proposal. The mechanisms below are hypotheses to test, not promised outcomes. Define site-specific limits and assign one accountable owner before ranking options.
| Option | Baseline and expected mechanism | Validation metric | Constraints and risk | Owner |
|---|---|---|---|---|
| Energy efficiency | Energy use by equivalent grade and period; test whether operating changes reduce consumption. | Energy per unit of in-spec product | Check process limits, production conditions, and whether savings shift to another utility. | Process or energy lead |
| Maintenance reliability | Work orders and downtime; assess whether a maintenance change reduces interruptions or repeat work. | Downtime, maintenance hours, and output | Account for planned outages, access, and reliability exposure. | Maintenance lead |
| Process control and material yield | Control records and material balance; test whether tighter control reduces variation or losses. | Yield, rework, and quality results | Protect specification and confirm measurement consistency. | Production lead |
| Procurement strategy | Separate purchase price from quantity consumed and delivery terms. | Comparable input price and consumption | Review supply dependencies, contract terms, and inventory effects. | Procurement lead |
| Specialty chemical optimization | Document the operational issue and current use before testing a formulation change. | Agreed process, quality, and handling measures | Require a controlled evaluation and review of product requirements. | Process and quality leads |
Evaluate chemical optimization without assuming savings
Match the evaluation to the application. Anti-caking agents, dust suppressants, coloring agents, and granulation aids address distinct plant needs, so do not treat them as interchangeable or infer performance from category alone. First define the observed issue, relevant product-quality requirements, and existing process conditions. Then agree on measures that show total process impact, including any adverse change. Results depend on site data and trial design.
Compare operational, maintenance, and procurement actions
Review dependencies, downtime exposure, approval needs, and measurement limits for every option. A procurement change may be quick to compare but exposed to supply conditions; a maintenance change may require a planned window; process adjustments may need quality review. Prioritize proposals with clear baselines and testable mechanisms, not unsupported savings estimates. This makes opex reduction in fertilizer production 2026 a risk-aware decision rather than a race to cut the largest visible line item.
For a chemical option tied to a documented plant issue, explore JAS fertilizer chemical solutions as one potential lever within the wider evaluation.
Build a 2026 Fertilizer OPEX Roadmap: Baseline, Pilot, Measure, Decide
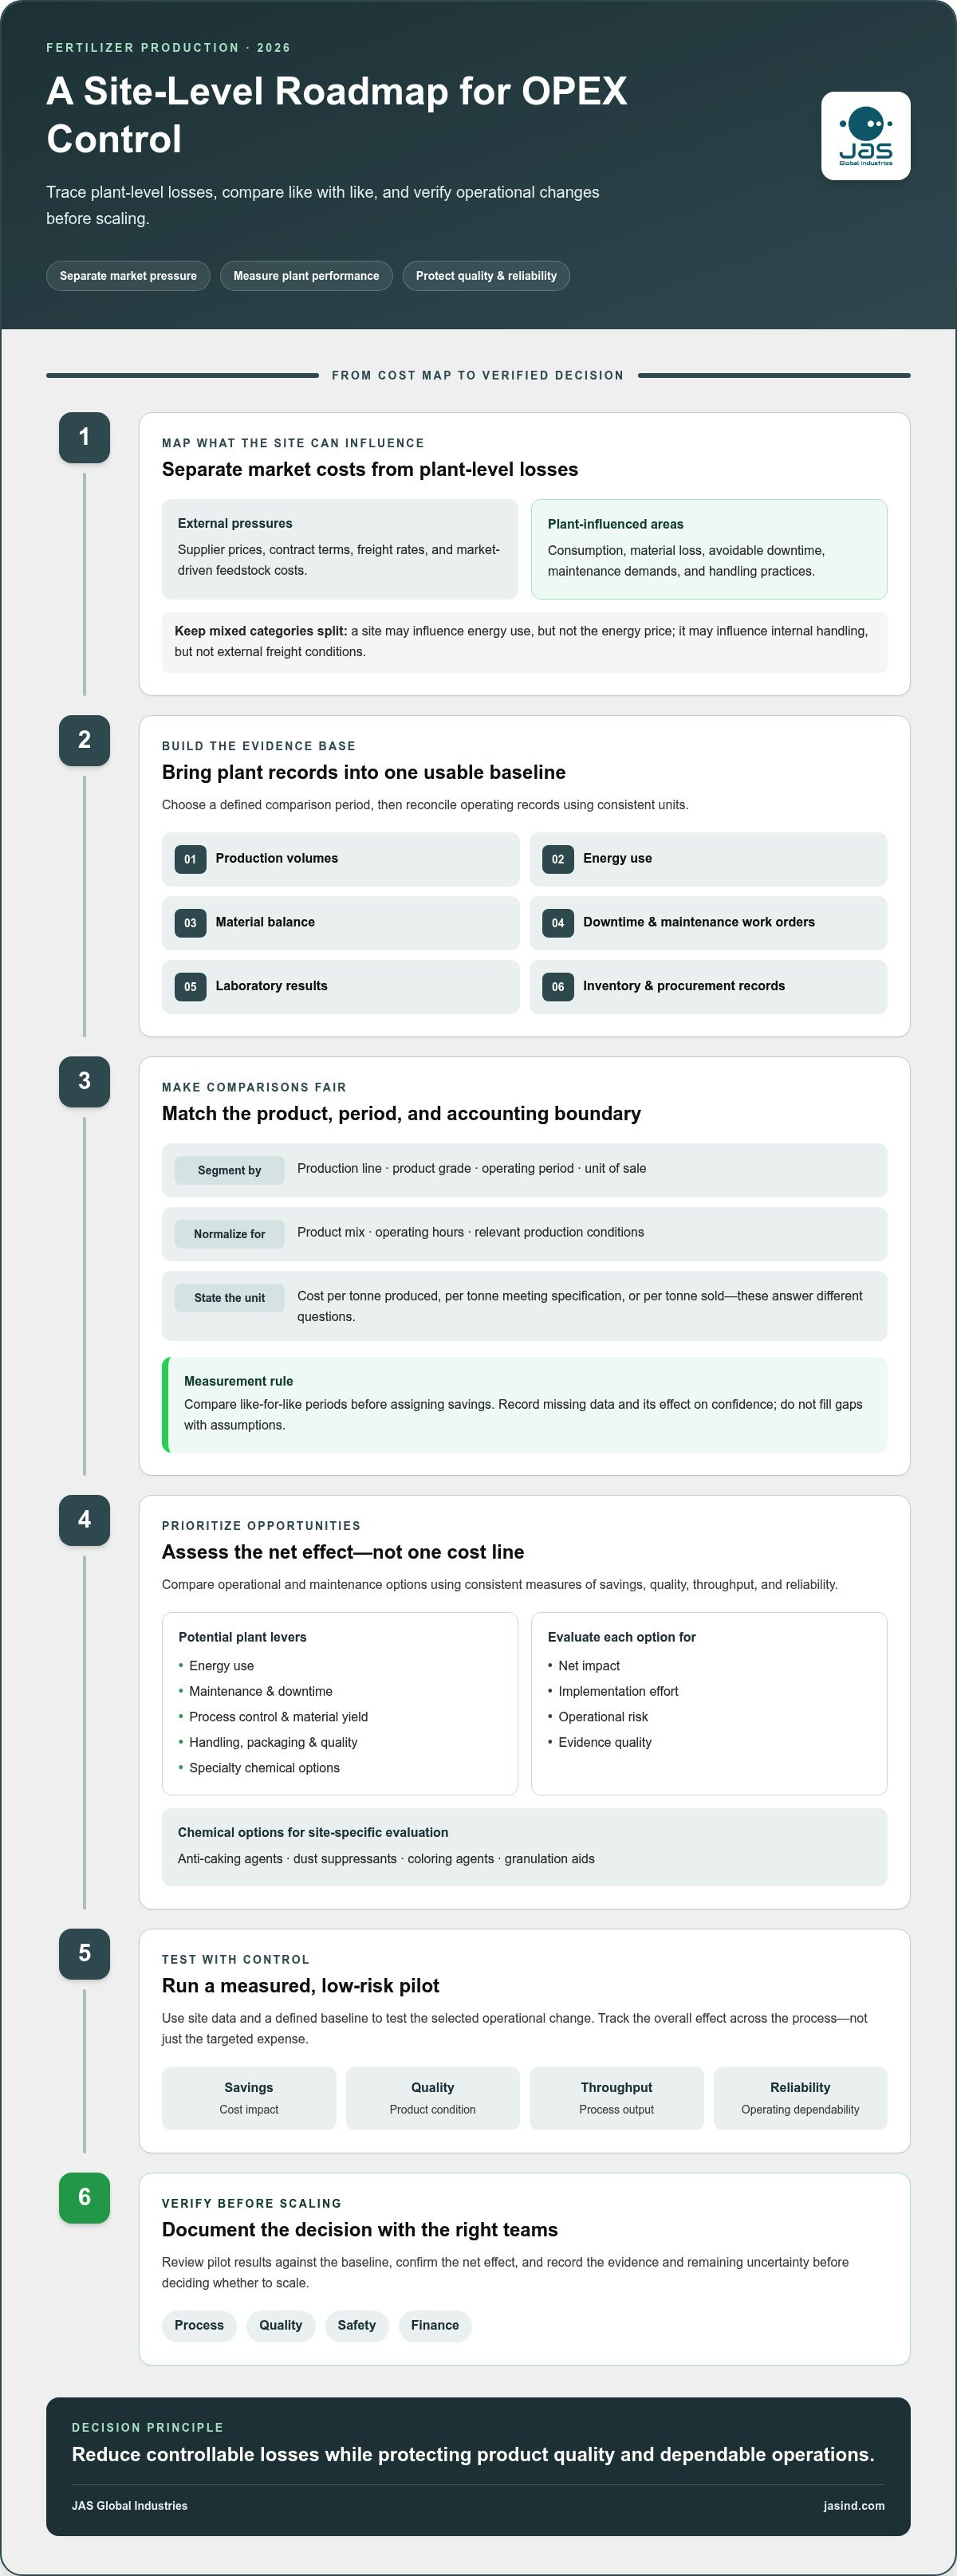
A cost idea becomes an operational decision only after a controlled evaluation. Use a staged roadmap to test a change without losing sight of product quality, safety, or reliable production. Each test needs one accountable owner and documented input from process, quality, safety, and finance reviewers. This governance keeps the technical result and its financial interpretation aligned.
- Baseline: Define the process boundary, comparison period, product scope, and current operating conditions. Record relevant cost and performance measures, along with known data gaps and assumptions.
- Prioritize: Rank proposals by the issue they address, strength of evidence, implementation effort, dependencies, and potential effect on quality and reliability. Select a testable opportunity, not simply the largest estimated saving.
- Controlled pilot: Write the test question, scope, constraints, approval path, and success measures before changing production conditions. Where practical, change one defined factor and record other conditions that could affect results.
- Measure and decide: Compare results with the agreed baseline, account for implementation or transition effects, then document whether to stop, refine, repeat, or scale.
Design a controlled pilot that protects production
Set guardrails before the trial begins. These may include site-defined quality limits, safe operating conditions, throughput expectations, and reliability requirements. Identify who can pause the test and how interruptions or unexpected results will be recorded. The owner should maintain the trial log, while process, quality, safety, and finance reviewers confirm the protocol and assess results from their respective perspectives.
Capture the product grade, operating conditions, relevant process settings, test timing, and any concurrent changes. If a guardrail is breached, stop or adjust the test according to the approved plan; do not treat an adverse result as noise. A clear record supports repeatability and helps distinguish the tested change from normal operating variation.
Measure net OPEX impact before scaling
Compare like-for-like production and cost data, including transition, implementation, maintenance, and any additional quality-control work. Separate measured consumption changes from price movements, product-mix shifts, operating-hour differences, and other simultaneous process changes. If several factors changed together, state that limitation rather than attributing the full result to one intervention.
Decision rule: Scale only after site data supports a net benefit within agreed quality, safety, and reliability guardrails. Record the evidence, exceptions, assumptions, approvals, and decision rationale so another team can understand and repeat the evaluation. This is a practical foundation for opex reduction in fertilizer production 2026, with decisions tied to observed plant performance rather than forecasts alone.
For a specialty chemical evaluation, JAS Global Industries provides tailored formulations and technical support spanning laboratory development, on-site implementation, and ongoing industrial support. Explore JAS fertilizer chemical solutions as one potential lever in a site-led pilot.
How JAS Supports Fertilizer OPEX Evaluation Through Tailored Chemical Solutions
Specialty chemical optimization can be one part of a broader plant OPEX program when a diagnosed issue relates to fertilizer handling, product condition, or granulation. JAS Global Industries supplies specialty chemical solutions for fertilizer operations, including anti-caking agents, dust suppressants, coloring agents, and granulation aids. The relevant category depends on the plant’s defined challenge, process conditions, and product requirements. No additive should be treated as a saving by default; assess its operational and cost impact against site evidence.
JAS has operated for over 25 years and provides technical support spanning laboratory development, on-site implementation, and ongoing industrial support. For an OPEX evaluation, this support can connect a plant-specific issue with a tailored formulation and a structured assessment. The aim is to establish whether a proposed option fits the application and meets agreed measures, not to assume an outcome before a trial.
Match a fertilizer additive evaluation to a defined plant need
Start with an observed issue and the evidence behind it. Summarize the affected product or process step, relevant quality requirements, current operating conditions, and available baseline data. Then consider which additive category fits the need: anti-caking agents for a documented caking concern, dust suppressants for an identified dust issue, coloring agents where color is a process requirement, or granulation aids where the challenge relates to granulation.
Keep the categories distinct. Set the trial scope and measures before interpreting results, including the process and quality indicators that matter to the plant. Where practical, document test conditions and other changes that could affect performance. A result is useful only when teams can distinguish the intervention’s observed effect from normal variation or concurrent process changes.
Turn technical collaboration into a measurable next step
Prepare a concise technical brief: describe the operating question, affected material and location, relevant process conditions, product requirements, baseline evidence, and known measurement gaps. This gives the technical discussion a clear starting point. Laboratory development and on-site implementation are part of JAS support, alongside ongoing industrial support, and can inform how a plant-specific evaluation is structured.
For opex reduction in fertilizer production 2026, specialty chemical evaluation should remain tied to the wider cost picture. Track the agreed operational and quality measures, consider implementation effects, and assess any cost change against the same production scope. Treat findings as site-specific and verify them before making broader decisions.
If your plant has a defined handling, product-condition, or granulation challenge, discuss fertilizer process optimization with JAS as a practical next step in evaluating whether a tailored chemical solution fits the process.
Turn Your Next OPEX Decision Into a Measured Step
The next opportunity may not require a major overhaul. It may start with one clearly defined process challenge and a disciplined investigation. Choose an issue your team can observe, establish what evidence would change your view, and agree on the quality and reliability limits that must be protected. That gives the next discussion a practical purpose, whether the result is a pilot, a revised approach, or a decision to hold.
For opex reduction in fertilizer production 2026, the value lies in building confidence before scaling a change. A measured evaluation can help teams move forward without treating cost reduction and dependable production as competing goals.
JAS Global Industries brings experience in fertilizer specialty chemicals and technical support to plant-specific discussions. Discuss fertilizer process optimization with JAS Global Industries to take the next step toward an evidence-led evaluation.
Frequently Asked Questions
What does OPEX include in fertilizer production?
OPEX covers recurring expenses associated with running a fertilizer plant, while capital investment generally relates to longer-term assets or major upgrades. The boundary depends on company accounting rules: one plant may include packaging and internal handling in its production costs, while another records them separately. State what is included, then use the same categories, production unit, and reporting period in comparisons. A higher input price alone does not show that operating efficiency has changed.
How can fertilizer manufacturers reduce OPEX without reducing product quality?
Start by identifying a measurable operating issue and setting quality limits that a proposed change must respect. For example, investigate recurring rework separately from excess energy use, then test a change against the quality measures relevant to that product grade. Keep records of operating conditions and other simultaneous changes. Lower expense is not a successful outcome if quality or reliability falls, and site evidence is needed to judge the net result.
Which fertilizer production costs are easiest to control in 2026?
There is no universal ranking: controllability varies with plant configuration, contracts, product mix, and operating practices. Teams can examine consumption patterns, downtime, maintenance routines, material handling, and process consistency using their own records. Feedstock and energy prices are often external exposures, although plant operations may influence consumption. For opex reduction in fertilizer production 2026, verify market conditions using dated sources and use local data to set priorities instead of assuming one lever fits every facility.
How should a fertilizer plant measure OPEX per tonne?
Divide the operating expenses included in a clearly stated cost boundary by comparable saleable production over the same period. For instance, do not compare a period dominated by one grade with a different product mix without noting that difference. Operating hours, rejected material, and rework can also affect the denominator or its interpretation. Document the method and assumptions, then align the metric with finance and operations reporting so teams are not comparing inconsistent figures.
Can anti-caking agents help reduce fertilizer production costs?
They may be relevant when a plant has a documented caking or product-flow challenge, but an anti-caking agent is not a guaranteed cost-saving measure. First identify where and under what conditions the issue occurs, and define the product-quality requirements that must remain satisfied. Then agree on trial measures, such as relevant handling observations and product checks, before reviewing costs. Only site results can establish whether the intervention changes the total operating picture.
What should a fertilizer plant include in an OPEX reduction pilot?
Include a precise test question, comparison basis, scope, accountable owner, operating limits, quality and safety criteria, and a method for measuring results. Record production conditions and note concurrent changes, such as a grade switch or maintenance work, that could affect interpretation. Before the test, define who reviews results and what decision follows. Document uncertainty as well as findings; scale only when evidence supports the decision within the agreed criteria.
How do fertilizer price increases affect production OPEX planning?
Input price increases can raise expenditure even if the plant consumes the same amount per tonne. Separate price variance from usage variance in reporting: procurement records help explain the former, while production and material data help investigate the latter. Use dated market information and scenario planning to frame exposure, not to present a forecast as certain. Pair that view with plant measurements so an external price shift is not mistaken for an operational efficiency gain.