
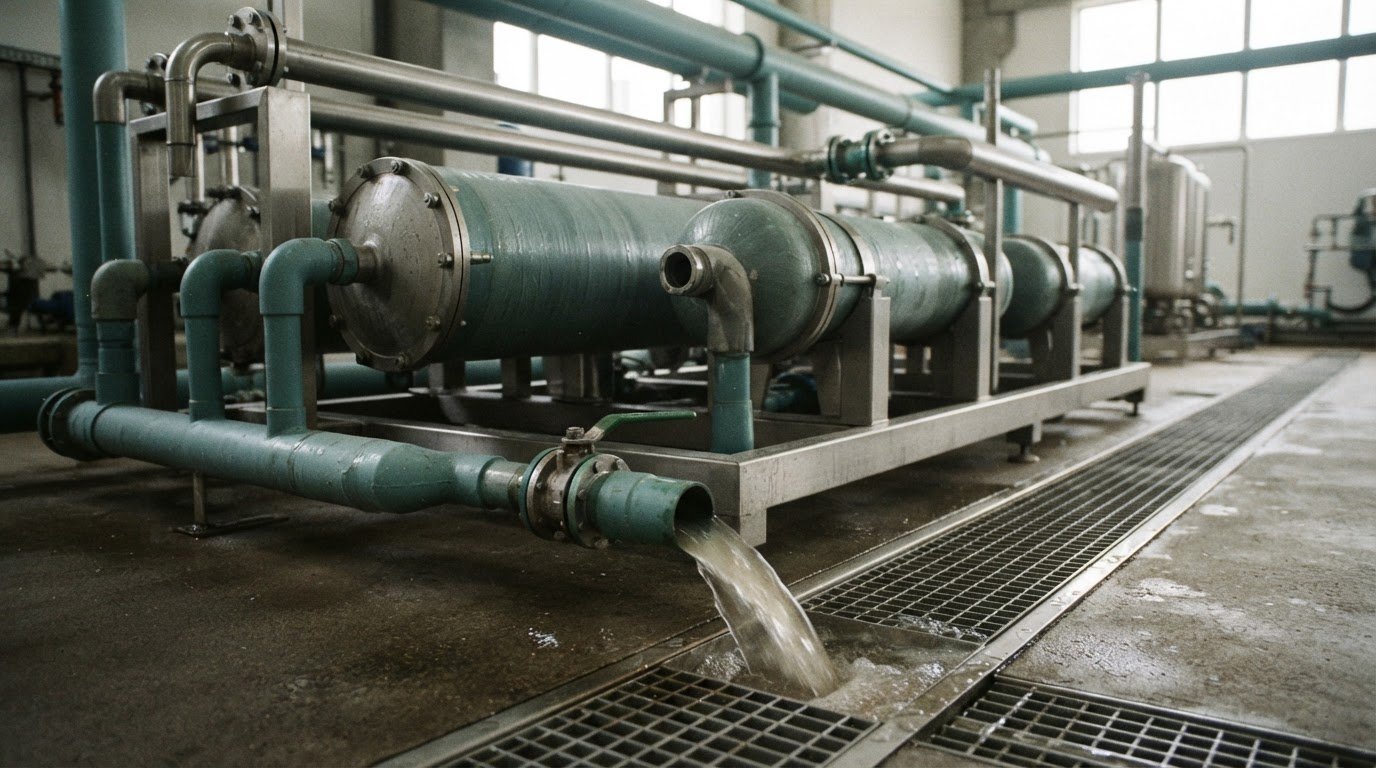
RO membrane fouling is the buildup of organic matter, particles, biological growth or mineral scale that restricts membrane performance. Diagnosing RO membrane fouling means reading operating trends alongside the water’s response to a fresh-water flush: reported recovery is about 90% of lost flow for colloidal fouling, compared with less than 60% for organic fouling. Biofilm-related fouling may recover less than 70%, then return quickly.
A drop in water production can be an early warning, but it does not identify the cause by itself. Pressure changes, conductivity, and feed-water conditions help complete the picture. This guide explains how organic matter and particles foul membranes, which performance signs can distinguish likely causes, and what a low-pressure fresh-water flush may reveal. Together, these clues provide a clearer basis for deciding what the system needs next.
What Is Fouling in RO Membranes?
Fouling is material accumulating on or within a reverse osmosis membrane, reducing water production or separation performance. Diagnosing RO membrane fouling means comparing normalized operating trends with feed-water and pretreatment conditions, not relying on one reading.
Recognizing Effects on Membrane Separation
Fouling restricts water movement across the membrane surface and can reduce permeate flow. Salt rejection may also decline, changing permeate conductivity. Track feed, concentrate, and interstage pressures, along with feed, concentrate, and permeate flow and conductivity. Record feed temperature as well. Baseline data from the first few weeks after startup or membrane replacement makes later changes easier to interpret.
Normalize performance for temperature and operating conditions before comparing trends. A 2023 review describes converting normalized RO values to a 25 degrees C reference condition. Rising differential pressure can indicate blockage, while reduced normalized permeate flow suggests plugging. Read these changes together: poor salt rejection can also reflect altered feed-water quality or inadequate pretreatment.
Assessing Coagulant Carryover and Pretreatment
Coagulant carryover occurs when pretreatment chemicals or captured material pass into the RO feed and contribute to deposits. Check feed turbidity, particle counts, and Silt Density Index (SDI), alongside pressure differentials across pretreatment stages.
A feed SDI15 reading of 4-5 correlates with colloidal loading. Residual cationic polyelectrolyte can also contribute to fouling, so review coagulant dosing and treatment performance when feed indicators worsen. Softening or coagulation may reduce organic-fouling potential even when hardness scaling isn’t the primary concern.
Distinguishing Types of RO Fouling
Scaling is mineral deposition, often concentrated toward the last membranes or final stage. Colloidal fouling involves fine suspended particles and often raises pressure drop. Biofouling involves bacteria and biofilm, sometimes visible as slime or accompanied by strong, unpleasant odors. Organic fouling occurs when natural organic matter accumulates on the membrane surface.
These patterns guide diagnosis, but operating data alone may not identify a deposit conclusively. Feed-water testing and, when needed, membrane examination can help distinguish overlapping causes. This distinction matters because cleaning chemistry and pretreatment responses depend on the foulant.
Use the membrane manufacturer’s operating and cleaning guidelines alongside normalized site performance trends. Compare pressure, flow, and conductivity with the element’s operating limits and established baseline.
Diagnosis and laboratory-analysis costs vary according to the sampling and tests required, and whether a membrane autopsy is needed. The scope of analysis is the main cost factor, so there is no single universal fee.
Useful tests include feed turbidity, particle counts, SDI, conductivity, and residual metals. A membrane autopsy can assess deposits and membrane condition; laboratory methods such as SEM-EDS can help characterize deposit composition.
Follow site procedures when sampling or inspecting equipment, including steps to isolate and depressurize it. Use appropriate protective equipment when handling process water, deposits, or cleaning chemicals.
Organic fouling from natural organic matter
Natural organic matter can accumulate on reverse osmosis membranes, restricting water passage and complicating separation. Its effects can overlap with colloidal deposits or mineral scale, so diagnosis combines feed-water evidence with membrane performance and deposit analysis.
Diagnosing Natural Organic Matter Fouling
Diagnosis looks for organic material in the feed and on the membrane, then relates those findings to operating trends. Organic loading in the feed can be one clue when assessing possible organic fouling, but it should be considered alongside other findings.
Laboratory analysis adds detail: SEM-EDS examination of long-term RO membranes found organic substances contributing 42.8 wt% carbon and 30.1 wt% oxygen. These findings can support an organic-fouling assessment, but should be interpreted alongside the feed-water composition and changes in normalized flow. Temperature also matters because it affects permeate flow, making temperature-corrected comparisons more meaningful.
Organic deposits may coexist with biofilm or silica scale. Chlorine-related membrane damage is a separate possibility: chemical attack can increase permeate flow and conductivity, rather than causing only the restriction associated with organic material. Distinguishing these patterns helps focus further testing and cleaning on the likely cause.
Organic Fouling and Calcium Binding
Divalent cations such as calcium can help organic foulants bind to the membrane surface. This interaction can strengthen deposition, so assessing organic matter alone may not explain persistent fouling.
Compare feed-water chemistry with deposit composition and performance trends. If calcium and natural organic matter are both present, their interaction may contribute to the observed layer; silica, by contrast, points to an inorganic scale concern. The distinction matters when selecting a treatment approach, since cleaning chemistry should reflect the contaminants present.
For process-chemistry considerations, explore reverse osmosis chemicals as part of a broader fouling-control strategy.
Colloidal and particulate fouling
Colloidal and particulate fouling develops as suspended material in feed water accumulates on a reverse osmosis membrane. These deposits can restrict permeate flow and increase the pressure needed to maintain production.
Recognizing Colloidal Fouling from Operating Trends
Suspect colloidal fouling when feed-water particle indicators worsen alongside declining normalized permeate flow or rising differential pressure. These trends connect feed conditions with changes in membrane performance, rather than relying on a single reading.
Assess feed-stream turbidity, particle counts, and Silt Density Index (SDI) together. A feed SDI15 target below 3 helps assess particulate risk at the RO inlet. Interpret these results with pretreatment records, since coagulant carryover or filter breakthrough can increase particles reaching the membrane.
Biological and particulate deposits can overlap. For example, a pressure increase with particle loading may indicate colloidal fouling, while slime or biofilm points toward biological growth. Multiple indicators help distinguish these causes and guide further investigation.
Colloidal Particle Accumulation
Colloidal foulants are fine particles described as ranging from 1 nanometer to 1 micrometer. Their small size allows them to remain suspended in feed water and collect along membrane surfaces or within feed-channel spacers.
Accumulation can form a layer that restricts flow through the element. In a study of membrane autopsies, colloidal matter was the main fouling group in 29% of cases. Biological and particulate or colloidal fouling together appeared in 60% of the studied cases, showing that deposits may combine rather than occur alone.
Check residual aluminium and iron in the RO feed, as elevated levels can contribute to particulate loading. The recommended inlet level for each is below 0.05 mg/L. Pair these measurements with turbidity and particle counts to assess whether pretreatment is controlling solids before they reach the membrane.
Use these findings to guide the next diagnostic step: compare feed-water results with operating trends and deposit evidence. Declining permeate flow alongside rising particle indicators supports concern about colloidal fouling, while biological evidence may call for a separate assessment. Select chemical cleaning for the contaminants identified, rather than assuming the cause from a pressure change alone.
Fresh-water flushing as a diagnostic test
A controlled fresh-water flush can show whether deposits are readily displaced, offering clues about the type of fouling. In RO systems, compare permeate flow before and after flushing to assess recovered flow, rather than treating the flush as proof of a single cause.
A diagnostic flush uses permeate or good-quality RO product water at low pressure. The described test runs for 30 minutes at 2-3 bar. Keep the operating conditions consistent, then compare post-flush flow with the lost flow against the system’s reference performance. This makes recovery a useful diagnostic signal, not a substitute for feed-water and pressure trends.
Recovery patterns can help narrow the possibilities. A fresh-water flush recovers about 90% of lost flow in colloidal fouling, but less than 60% in organic fouling. Biofilm fouling has flush recovery below 70% and can return quickly. A strong initial recovery followed by renewed decline therefore deserves follow-up, including checks for biological growth.
Limited recovery can point to deposits that a flush alone does not remove. Mineral scaling, for example, may remain after a water-only flush, while mixed deposits can make the result harder to interpret. Read the flush response alongside pressure changes, feed-water quality, and permeate-flow trends. Filtration and pretreatment performance also help explain whether particles continue reaching the membrane.
Use the result to guide the next diagnostic step, not to choose chemical cleaning based on recovery alone. Fouling type, membrane requirements, and RO operating conditions all matter when selecting a cleaning approach. Consistent records make repeat flushes more comparable and help show whether performance changes after treatment.
For a treatment approach matched to RO system needs, explore reverse osmosis chemical solutions.
JAS Global Industries
JAS Global Industries develops tailor-made specialty chemical formulations to support process efficiency and operational reliability. After identifying likely fouling causes, connect the findings with the treatment chemistry and operating conditions involved. JAS serves industrial sectors including water treatment, where understanding process requirements helps shape a suitable chemical approach.
JAS also supplies solutions for fertilizer and mining applications. A useful discussion starts with the process challenge, relevant operating context, and the role chemistry needs to play. Contact JAS Global Industries to discuss your industrial chemical requirements.
Turn fouling diagnosis into a sound treatment decision
Use the diagnosis to shape the next operating decision, not simply to justify another cleaning cycle. Relate membrane behavior to feed-water chemistry, pretreatment performance, and process conditions that may sustain deposits. This keeps corrective action focused on the likely cause and helps protect reliable water production.
A disciplined approach to diagnosing RO membrane fouling turns operating evidence into a clearer treatment direction. Where chemical intervention is appropriate, compatibility with membrane materials and identified contaminants matters as much as product choice. JAS Global Industries offers Reverse Osmosis Chemicals for industrial water-treatment applications.
Record the decision, treatment applied, and subsequent operating response in the same system log. This creates a practical reference for future changes and supports more informed decisions across the RO operation. If you’re assessing chemistry for your process, contact JAS Global Industries. A clear next step can move your team toward a considered treatment plan.
Frequently Asked Questions
Clean It or Replace It?
Clean the membrane when performance decline aligns with a reversible deposit, and consider replacement when cleaning cannot restore acceptable operation or damage is suspected. Rule-of-thumb cleaning triggers include normalized permeate flow dropping about 10%, pressure drop rising about 15%, or product salinity increasing about 10%. These indicators prompt assessment, not automatic replacement. Membrane condition, cleaning history, and whether the problem is fouling or chemical damage all influence the decision.
What Is Scaling in RO Systems?
Scaling occurs when mineral material precipitates and deposits on RO membranes as water passes through the system. Calcium carbonate, calcium sulfate, and silica are examples of scale-forming minerals. Deposit location can help distinguish scaling from fouling: fouling often develops near the system front, while scaling commonly appears toward later elements or stages. This pattern helps direct inspection, although mixed deposits can make location alone inconclusive.
Which operating parameters should I trend to catch fouling early?
Track normalized permeate flow, differential pressure, and salt passage together, then compare changes by stage where measurements allow. For example, a gradual flow decline with increasing pressure points to a developing restriction, while rising salt passage without reduced flow can suggest membrane damage or a seal or bypass problem. Include feed temperature and conductivity in the record, since both affect flow and interpretation.
Why does bacterial fouling appear in spring and autumn?
Spring and autumn are not universal triggers for bacterial fouling; seasonal patterns depend on local feed-water changes and plant conditions. Shifts in source-water quality, organic loading, or pretreatment performance can alter the material reaching membranes and encourage biofilm development. Compare feed-water and operating records across seasons, and assess biological evidence such as slime or odor rather than attributing a change to the calendar alone.
What are the common types and causes of reverse osmosis membrane fouling?
The main categories are scaling, biological fouling, colloidal fouling, and organic fouling. Scale forms from dissolved minerals; biofouling involves microorganisms and biofilm; colloidal deposits come from fine suspended matter; and organic fouling comes from natural organic substances. Causes can overlap: organic matter and calcium, for example, can interact at the membrane, while poor solids control can add particle deposits.
What symptoms indicate fouling in an RO system?
Common warning signs include declining normalized permeate flow, rising differential pressure, and changes in salt passage or permeate conductivity. Biological deposits may also produce visible slime or strong, unpleasant odors. Interpret the combination and timing of signs: a conductivity change alone can reflect feed-water or temperature shifts, while pressure and flow changes together more strongly indicate a developing restriction. Stage-level trends help locate where performance is changing.